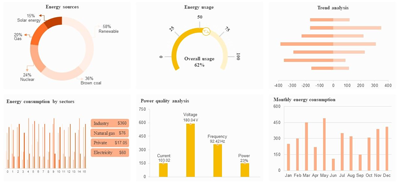


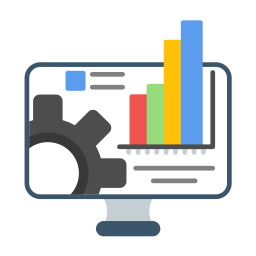
Track real-time consumption across parameters — voltage, current, power factor, harmonics, and more.

Detect abnormalities instantly using AI-based thresholds and predictive alerts.

Monitor performance, uptime, and health of critical assets to plan proactive maintenance.
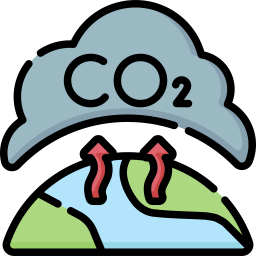
Automatically calculate carbon emissions, benchmark energy intensity, and forecast savings.

Design tailored dashboards for management, operations, and sustainability teams.

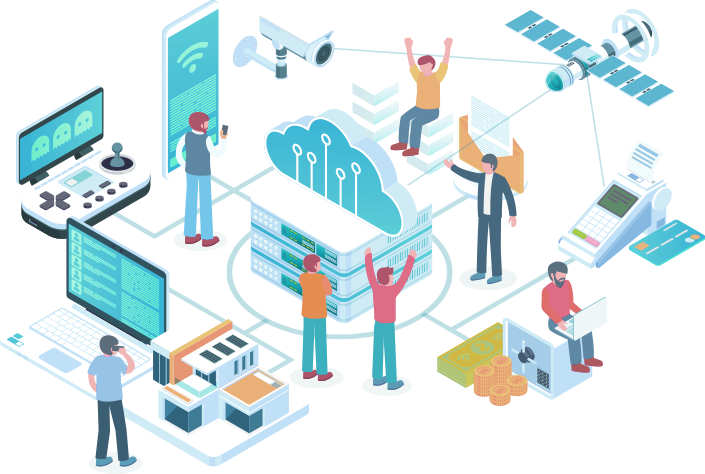
Connect with BMS, EMS, SCADA systems, or cloud data lakes effortlessly.


Connect
Integrate your existing sensors, smart meters, and controllers with the BayaSense gateway.
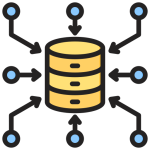
Collect
Continuous data capture with secure transmission and intelligent normalization.

Analyze
AI-driven models identify trends, inefficiencies, and performance deviations in real time.

Act
Trigger alerts, generate reports, toke action and track outcomes.